
Gold, the Dollar and De-Dollarization
Golds recent behavior brings to mind an old song lyric, “Somethings happening here, but what it is ain’t exactly clear.” Gold recently experienced its third major rally in the past 58 years. It’s price was $39.40 per ounce in 1968 and peaked last Thursday, January 29, at $5608.35. That CAGR (compound annual growth rate) is 8.9% per year. Not bad for an asset that many scoff at as an ancient relic, that has no intrinsic value, that doesn’t pay a dividend.
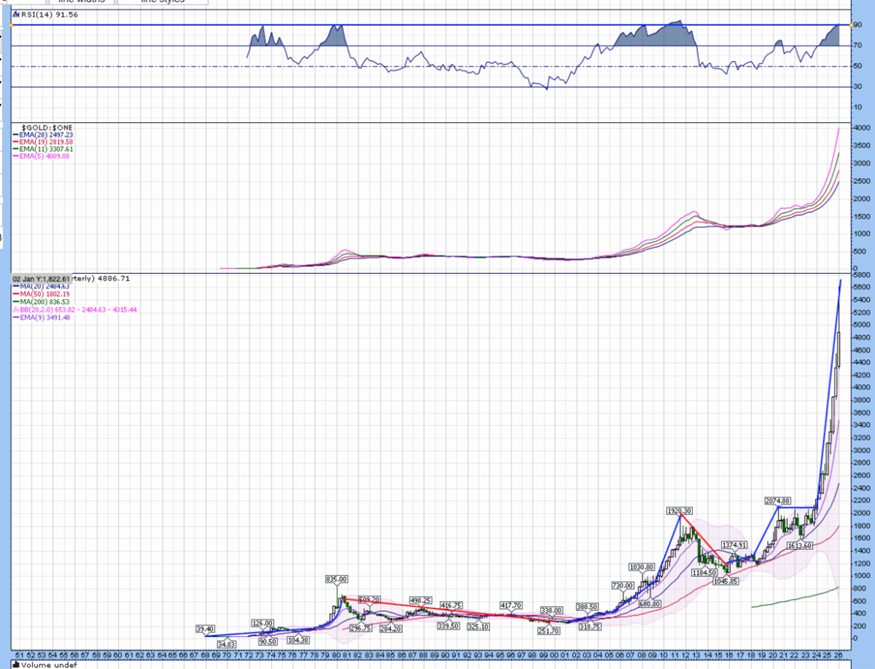
The first rally started in 1968 with gold at $39.49 and ended in 1980 at $835.00. The second rally started in 2001 with the price at $253.71 and ended in 2011 at $1920.30. The third rally started in 2016 with the price at $1045.85 and peaked last Thursday at $5608.35. It sold off sharply late Thursday and all day Friday. (Source: Stockcharts.com historic data) Here is the chart of that 58 year journey. In this format the chart below is too small for you to see detail. But you can see the peaks of the rallies. You can also see that the latest rally was explosive compared to previous ones.
For the short term gold’s upward momentum is broken. It may retreat further, just as it did after past rallies. I am of the opinion that it won’t retreat as much this time and the next rally could start much sooner. I will explain why, but first here is a little history lesson and some other interesting facts that are helpful to understand what’s happened so far.
Relative Strength Index (RSI) peaked over 90 at the top of each rally
There was a common characteristic during all three rallies. Each peaked with the Quarterly Relative Strength Index (RSI) over 90. You can see this in the top portion of the chart, highlighted by the blue horizontal line. This is unusual for any asset! It happened once for the S&P 500 (1998-2000) and once for the Dow Jones Industrial Average (1996-1998) during the same 58 year time period.
The Relative Strength Index (RSI) is a key technical measure of both the speed of change and the actual price change of any asset. I use it all the time in technical analysis of assets. An RSI above 70 indicates overbought conditions. An RSI below 30, indicates oversold conditions. So an RSI of 90 is EXTREMELY OVERBOUGHT! It’s an indication that the next major move is likely to be down, and that is what happened each time. The problem, particularly for traders, is that we never know exactly when that next major move will occur, or what will trigger it. For example, RSI got to 90 back in 2009 and stayed there until 2012 before finally breaking down.
After each rally peaked the price of gold retreated substantially, but it never retreated back to the low experienced in the previous period. For example the low in the 1968-1980 period was $39.49. The lowest price after the 1980 peak was $251.70. The lowest price after the 2011 peak was $1045.85. (Source: Stockcharts.com Historic Data) Gold’s price rise has been a “two steps forward and one step backward” process for 58 years. I believe that gold will find a bottom relatively soon and then start to work its way up to much higher prices. In the meantime market mavens are all opining on why the rally took place and what triggered the sudden sell off. Financial Times recently published this comment that seems to capture the consensus opinion about why the rally happened:
“Macro uncertainty has been a big driver of prices over the past few months, and traditionally, metals prices have moved higher with a weaker dollar. However, the dramatic scale of the price rises and falls is historic. Retail investors flooding into precious metals-backed ETFs have turbocharged the price moves — particularly for gold and silver, and to a lesser extent copper.”
They published this chart to graphically explain what they believe triggered the selloff:
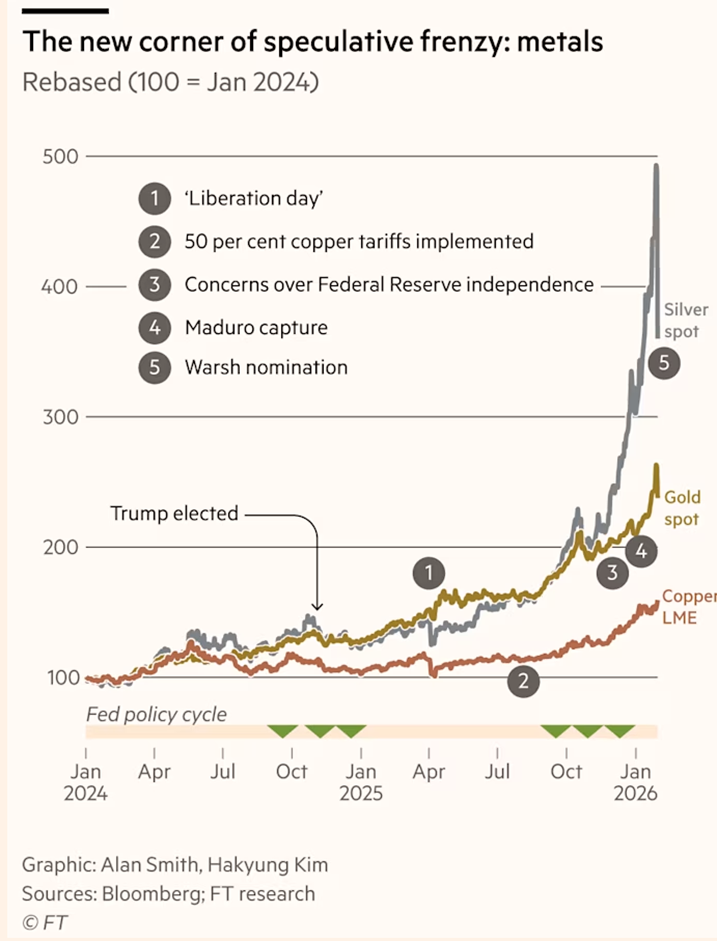
They attribute the sell off to the nomination of Kevin Warsh as the new chairman of the Fed. This has been the most common attribution and seems to be consensus opinion.
Interestingly almost no one has mentioned that the CME Group raised margin requirements on metals including gold, silver, and copper. This was announced after the market close on January 29 to take effect on Monday, February 2. Raising the margin requirements means that investors who borrowed money to buy gold would suddenly have to put up more capital to maintain their position. It seems that many chose to take profits instead. I believe that is likely the much more proximate cause of the sell off. As for Financial Times, these important considerations are missing from their opinions:
1. The rally in gold prices started in 2018 and accelerated in 2022, not “over the past few months”.
2. If Warsh’s nomination was the cause of a short term sell-off, it has nothing to do with a longer term trend “that is different this time”.
Major drivers of a longer term rally
Many central banks, especially outside the U.S. and in emerging markets, have been accumulating gold to diversify away from U.S. dollar–denominated assets amid geopolitical and currency risk concerns. This is a structural and long-term force rather than just a short-term tactical move. Central banks’ gold purchases averaged more than 1000 tons annually in 2024 and 2025, reflecting a deliberate strategic shift. It’s more than double their average annual purchases of the previous decade.
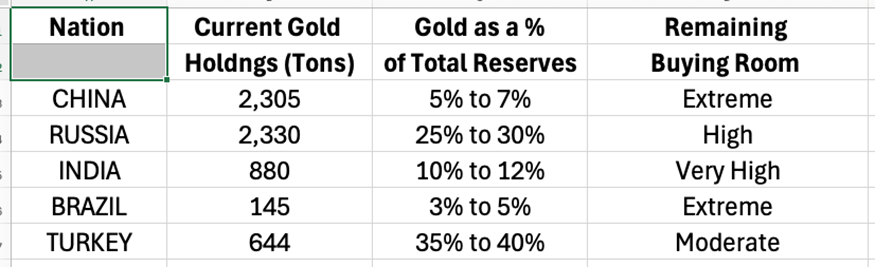
To put the numbers and percentages in this table in perspective for you, it’s estimated that the United States holds 8,133 metric tons of gold, which is approximately 70 to 75% of its total foreign exchange reserves. Most nations hold foreign exchange (Forex) reserves to protect their own currency. Since the U.S. Dollar is the world's primary reserve currency, the U.S. does not need to hold large amounts of Euros, Yen, or Yuan to stabilize the dollar, thus the large percentage in gold.
Structural shift away from the U.S. dollar
The current multi-year rally in gold is not a speculative bubble like we’ve seen in the past. Nor is it a couple of brothers trying to corner a market, like the Hunt brothers did with silver during 1980. These gold purchases are a structural shift driven by sovereign countries and followed by institutions. Like it or not, the primary driver of this rally has been a strategic move by nations to insulate themselves from the U.S. financial system. The BRICS nations have been working on that for years. But the trend has spread and accelerated recently. Many attribute the acceleration to the following U.S. policies:
1. The freezing of $300 billion in Russian foreign reserves in 2022 is pointed to as the wake up call, when central banks realized that their dollar-denominated assets, like Treasury bonds, carried significant political risk.
2. Sanctions against Iran were a second wake up call.
3. Recent tariffs were the third wake up call. This one was world-wide. Almost every foreign nation has felt the impact. The long term ramifications are still developing.
All three have acted to increase the appeal of gold which is the only major reserve asset that is not someone else’s liability. It can’t be frozen, hacked, or devalued by a single governments monetary policy. In my opinion, this has made it the cornerstone of the de-dollarization movement. Unlike retail buyers, who might stop buying when prices get too high for their taste, central banks are buying strategic reserves. They can be less price sensitive, meaning they can continue to accumulate to reach a specific percentage of their total reserves, e.g., trying to get gold to 10% or 20% of their total holdings.
The remaining "buying room” on the table above isn't just a metric; it should be multi-year tailwind. Even after the massive rally of 2024–2025, these nations are still in the early-to-middle stages of rebalancing their portfolios away from the dollar. If China were to move its gold allocation from 7% to just 15% (still far below the U.S. level), it would require them to purchase thousands of additional tons, potentially more than the total annual global mine production.
So, what’s really different this time?
Historically, run-ups in gold during the past 50+ years were driven by fear or greed. Today’s movement is different. It’s being driven by the world’s largest central banks. Since early 2024, sovereign nations have been moving out of paper debt and into physical gold at record levels. I view this as a permanent structural shift for two primary reasons:
1. Protection against counterparty risk. Most investments are someone else's promise to pay. A stock is a claim on a company; a bond is often a claim on a government. Gold is the only major financial asset that is not someone else’s liability. It carries no political risk. It can’t be frozen, hacked, or devalued by a single government's policy.
2. A buffer for the multipolar migration. We are moving from an era where the U.S. Dollar was the only game in town to a multipolar world. As nations like China, India, and Brazil rebalance their national savings, they are using gold as the new global ledger. They are holding an allocation to ensure their reserves are not solely dependent on a single currency’s resilience.
But aren’t we forgetting that gold has no intrinsic value?
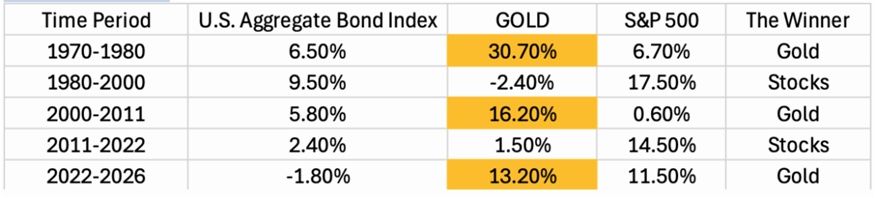
That is the classic argument against owning gold. “Intrinsic value” definitions vary, but Warren Buffett defines it as “the discounted value of the cash that can be taken out of a business during its remaining life”. He famously views gold as a non-productive asset that doesn't generate income, preferring productive assets like businesses, land, or stocks that create value, cash flow, or dividends. He'd rather own a farm or apartment than gold because gold just sits there. I respect Mr. Buffett’s opinion, but I also respect this quote from an unknown author: “Gold doesn’t have intrinsic value like a business does. It has monetary value that survives changes in political and financial systems. That’s why gold underperforms productive assets over long stable periods and massively outperforms during regime stress.”
Since 1970 we can see five distinct periods in which stocks and gold outperformed or underperformed each other. Interestingly gold outperformed bonds during three of those periods as well.
I firmly believe we are in an era of regime stress, not only in the United States, but also worldwide. This is the first time that there is a concerted global effort to decouple from the U.S. dollar.
I’m not the only one recognizing it’s different this time
On February 2, 2026 JP Morgan strategist Gregory Shearer said this on CNBC:
“Even with the recent near-term volatility, we believe longer-term rally momentum will remain intact, and we remain firmly bullishly convicted in gold over the medium-term on the back of a clean, structural, continued diversification trend that has further to run amid a still well-entrenched regime of real asset outperformance vs paper assets.”
Shearer also raised his year-end target on gold to $6,300 an ounce. That’s 33% above where gold traded early Monday.
ING Economic and Financial Analysis published this February 3, 2026:
“For gold, the recent correction does not appear to reflect a change in the underlying macro narrative. Safe-haven demand, ongoing central bank purchases, and the outlook for real rates remain supportive over the medium term…. Although central bank purchases moderated slightly last year, institutions remain significant net buyers. At current price levels, and following the recent correction, central banks are likely to become more active again. Their demand tends to be strategic, long-term and largely insensitive to short-term price swings, reinforcing gold’s structural support over the medium term.”
This headline appeared in SeekingAlpha.com February 3, 2026:
“Deutsche Bank stands firm on $6,000 gold target as it says the bullish case remains intact.”
Societe Generale says that their fundamental outlook for gold has not changed, February 3, 2026:
“It looks like the worst could be behind us. With leveraged speculative positions flushed out, investors may feel they are returning to a freshly cleaned playground, albeit cautiously,” she said. “The factors supporting gold prices since last year remain firmly in place: trade and geopolitical uncertainty persists; G7 debt dynamics look increasingly unsustainable and are likely to worsen — not only in the US with the ‘Big, Beautiful Bill’, but also in Japan and in Europe amid rising defense spending. Appetite for the US dollar, other major currencies, and sovereign bonds remains fragile, and that should continue to underpin the bullish case for hard commodities.”
Ed Yardeni, recently told viewers of CNBC that “Gold could see a major rise by the end of this decade. He believes, “the metal could reach $10,000 per ounce by 2029”. For what it’s worth, I have long admired Yardeni. Like anyone trying to predict the future he’s made some incorrect forecasts, but he is widely respected. His reputation has been built on deep data driven independent research.
5T Wealth currently offers our Core and Smart Beta strategies, which hold allocations to iShares Gold Trust (IAU). The rest of the assets in these series are allocations to stocks and bonds, with focus on the U.S. large cap growth stocks. That has worked very well for the past few years.
New All Weather strategy under development
In recognition of much of what is presented in this newsletter we are developing a more “All Weather” strategy that will feature a larger allocation to gold and other commodities, other alternatives to stocks and bonds, and changes in the mix of the types of stocks and bonds. The new strategy is designed to lower volatility and hopefully outperform should we enter a period of stagflation similar to the 1970's when gold dramatically outperformed.
Our second motivation is that “it’s different this time”. History may not repeat. It may be de-dollarization, which is a new “regime stress”, that will cause gold and other commodities to outperform. The “All Weather” strategy will be investible by March 30, 2026.
All the best,

Paul Krsek
CEO
5T Wealth, LLC
Main (707) 224-1340
Cell (707) 486-7333
Paul@5twealth.com

Disclosure and Disclaimer - Updated last on October 14, 2025:
CEO's Corner is a proprietary newsletter written for clients, friends, and affiliates of 5T WEALTH, LLC (5T), which is an SEC registered investment advisor. Information presented is for educational purposes only. The information does not intend to make an offer or solicitation for the sale or purchase of any specific securities, investments, or investment strategies. Investments involve risk and are not guaranteed. 5T has reasonable belief that this letter does not include any false or material misleading statements or omissions of facts regarding services or investments. 5T has reasonable belief that the content as a whole will not cause an untrue or misleading implication regarding the adviser’s services, investments, or client experiences.
The opinions expressed are those of the author and are subject to change without notice. The opinions referenced are as of the date of publication and are subject to change due to changes in the market or economic conditions and may not necessarily come to pass. Any opinions, projections, or forward-looking statements expressed herein are solely those of the author. They may differ from the views or opinions expressed by other areas of 5T and are only for general informational purposes as of the date indicated.
5T has presented information in a fair and balanced manner. 5T is not giving tax, legal, or accounting advice.
Past performance should not be considered an indicator of potential future performance. If you do not consider yourself suitable, either emotionally or financially, to experience volatility and/or losses in financial markets, you should not invest. The portfolio managers at 5T do not guarantee investment results.
Charts, displays and graphs may be used as illustrations. They are not intended to be used by themselves to determine which securities to buy or sell, or when to buy or sell them. Such charts and graphs offer limited information and can’t be used on their own to make investment decisions.
CEO Corner does not represent the opinions of Fidelity, Fidelity Institutional Brokerage Group, NFS or anyone employed by Fidelity in any capacity. Neither Fidelity, Fidelity Institutional Brokerage Group, nor NFS, nor anyone employed by Fidelity in any capacity has participated in the creation of CEO Corner and they are not responsible for the contents or distribution of CEO Corner.
CEO Corner does not represent the opinions of Charles Schwab Corporation, Schwab Advisor Services or anyone employed by Schwab in any capacity. Neither Charles Schwab Corporation nor Schwab Advisor Services, nor anyone employed by Schwab in any capacity has participated in the creation of CEO Corner and they are not responsible for the contents or distribution of CEO Corner.
The investment objectives of various strategies mentioned in CEO Corner may be substantially different from one another. Therefore topics or investments mentioned in CEO Corner may or may not apply to specific managed accounts and/or strategies. If you are unsure which strategies your accounts are invested in please ask a representative of 5T to clarify that for you.
The assets held in managed accounts at 5T may include stocks, bonds, cash, commodities, foreign exchange, mutual funds or exchange traded funds (ETF's), money market accounts or limited partnerships that represent the same. They are subject to market fluctuation and the potential for losses. The assets are not insured. The value and income produced by these investment products may fluctuate, so that an investor may get back less than they initially invested.