I'm fortunate to be an investor, and so are you
I find myself more and more focused on the great wealth divide in the U.S. and the increasing concentration of wealth in fewer and fewer hands. I consider myself fortunate to be an investor, and therefore able to increase my wealth by making money work harder rather than Meghan and me working harder. There are many families in this country who can’t do that.
As of early 2026, data from the Fed and the Census Bureau confirms that wealth continues to be increasingly concentrated in a smaller segment of the population. We are currently seeing levels of wealth inequality in the United States that have few historical precedents. Collectively, the wealthiest 1% held about $55 trillion in assets in the third quarter of 2025 — roughly equal to the wealth held by the bottom 90% of Americans combined. (Source: MoneyWatch, January 21, 2026)
Interestingly, while concentration at the very top is increasing, the number of millionaires is also at an all-time high (roughly 1 in 6 families). However, due to inflation, many of these families don't "feel" wealthy. Research from Charles Schwab and Visa in 2026 suggests that Americans now believe a net worth of $2.3 million is the true psychological threshold for being wealthy—nearly double what it was a generation ago. When I was a kid, in the 1950’s and 1960’s, being a “millionaire” seemed like the epitome of wealth. I never thought I would become one. Today the epitome of wealth starts with a “B”!
It’s not the divide between the millionaires and billionaires that I’m focused on. It’s the divide between them and everyone else that concerns me. Every day I talk with people who are worried about the war, the economy, inflation, the national debt, deep polarization, threats to democracy, the very future of our country. A few of our clients are so worried they have moved their portfolios entirely to cash. And yet, with the exception of a few weeks during most years, I watch my portfolio grow, along with those who stay in the markets despite all of their misgivings. The S&P 500 hit a new all-time high last week! I wouldn’t have a worry in the world if all I considered was the growth of my investment portfolio. One of the key messages I want to deliver in this letter is stay invested! As scary as it is at times, it’s worked over many decades. That’s not to say that you should be aggressive at all times. It’s not to say that you can’t change the risk profile of your investments. It is to say, don’t intentionally turn yourself into a non-investor.
I worry about those who aren’t investors because they can’t afford to be. There are a lot more of them than there are of us. Many are falling farther behind. “The top 1% of households owned 31.7% of all U.S. wealth in the third quarter of 2025, the highest share on record since the Federal Reserve began tracking household wealth in 1989. That share has increased even as wealth growth for the rest of the population has stalled or slowed.” (Source: MoneyWatch, January 21, 2026)
While we’ve celebrated a series of new all-time highs in the stock market, lots of data is pointing the other direction and giving us clues as to how the non-investors are doing. For example, consumer sentiment is near a 50 year low. Check out this chart that tracks consumer sentiment back to the 1970’s. The grey bars indicate recessions. You can see that consumer sentiment usually bottoms out during recessions. Yet it's now at an all time low during what's supposed to be a booming economy.
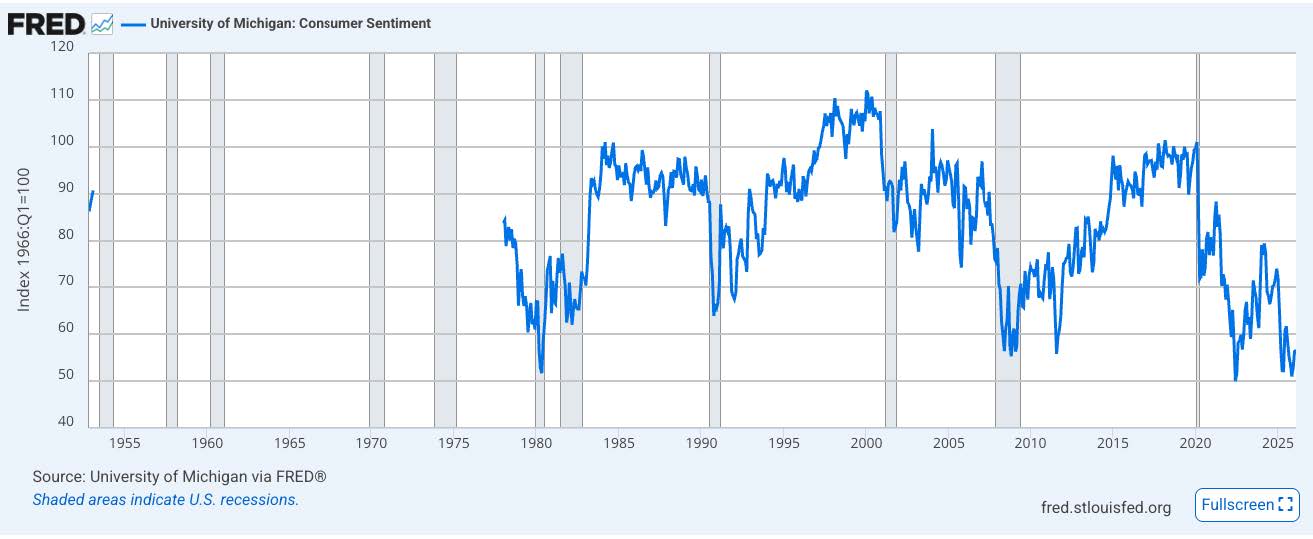
(Note: This data is as of March 27, 2026. The next release date will be April 24, 2026)
Affording a house continues to be a more elusive goal. The next chart, from the Federal Reserve Bank of Atlanta, helps us understand the problem. As of January 2026 the average price of a home in the U.S. was $390,967. I know how ridiculous that must seem to California or Florida residents, but it’s a fact! The income needed to afford that “average house” was $117,047. The actual median income in the U.S. was $85,497 during this reporting period. That makes it hard to afford that house!
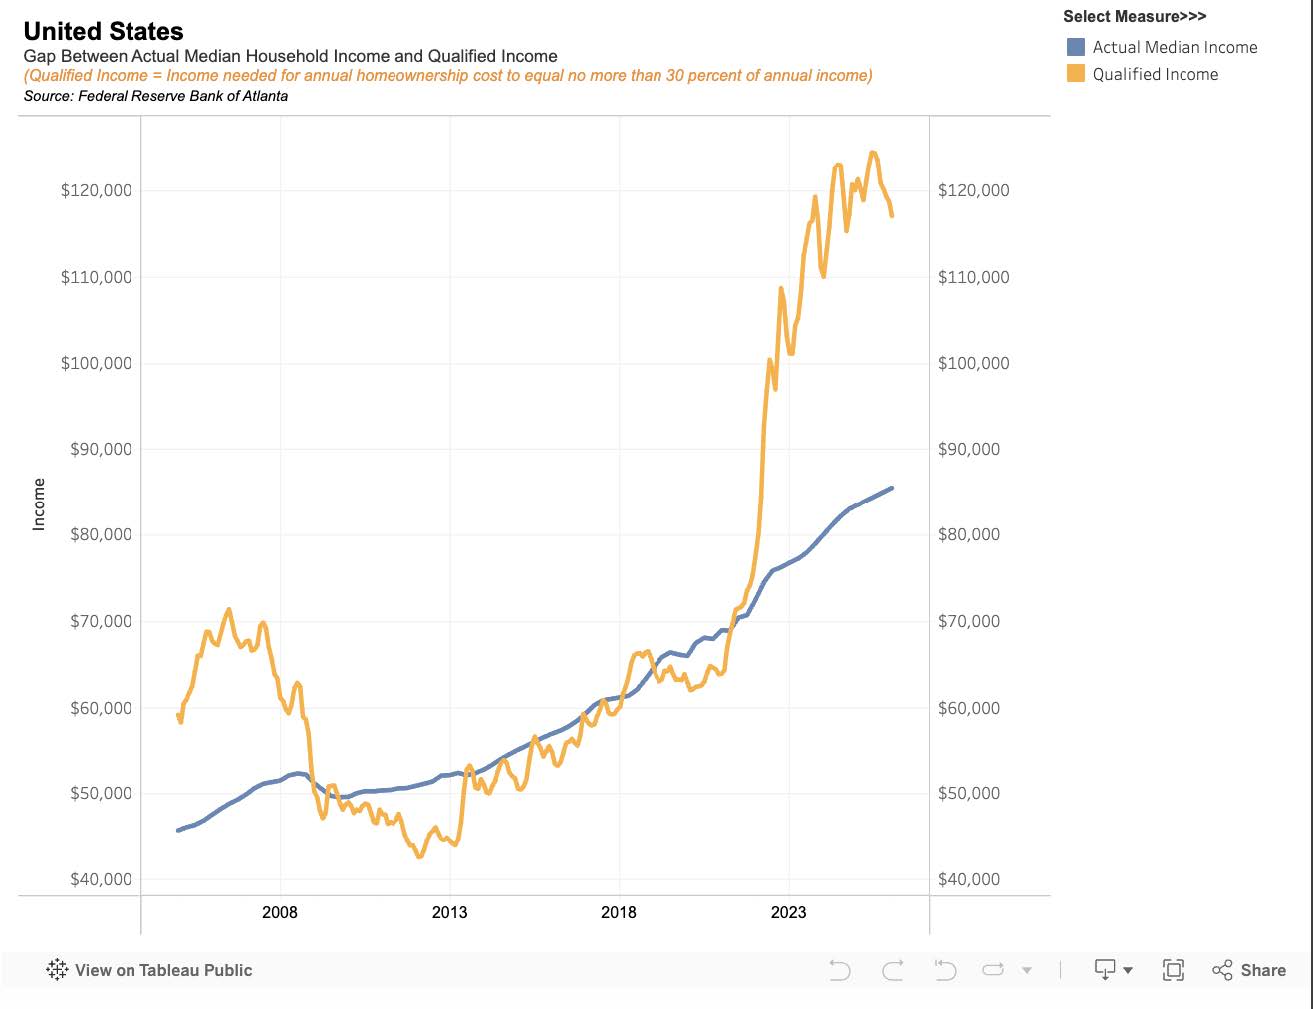
In the Napa Valley the gap is even wider. Gemini tells me that the “average home price” is currently $886,117 and the “median household income is $116,139”, based on the most recent 2024-2025 data.
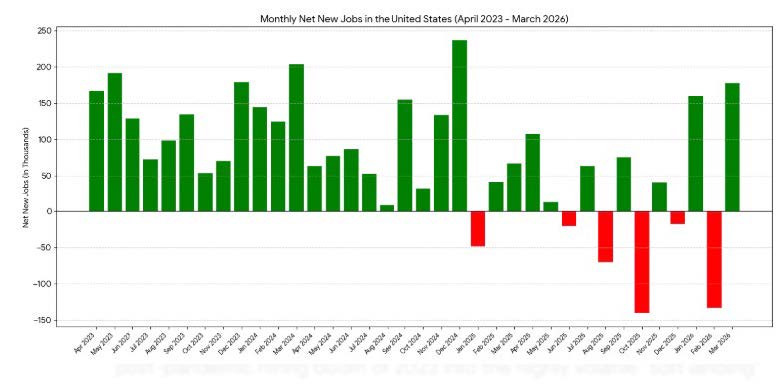
To have a “median income” it’s best to have a job! Many people do, but new job formation is clearly slowing. Our next graph shows monthly net new jobs by month for the past 36 months. You can clearly see that we’ve moved from consistent job growth to sporadic job growth.
If you have a job, it’s best if it pays a “living wage” that keeps up with inflation. The next chart shows wage growth over the past 36 months. The good news is that its kept up with “official” inflation statistics, but you can clearly see the downward trend that’s formed.
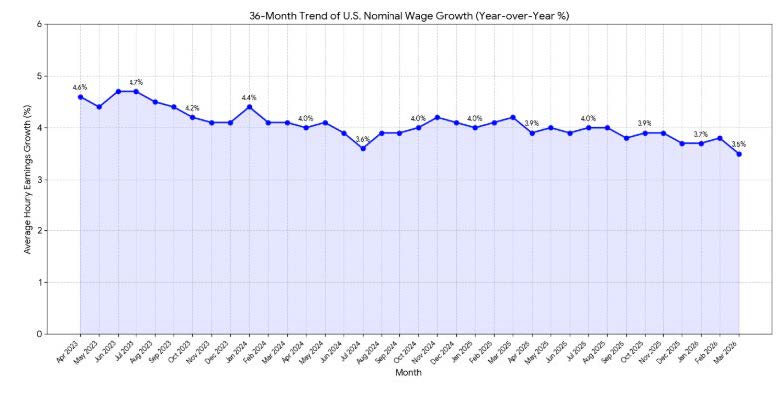
(Note: From the U.S. Bureau of Labor Statistics)
We still have significant disparity between the wages of men and women; median weekly wage of $1,362 for men and $1,098 for women. There is still a huge “education premium”; $1,763 for workers with a bachelor’s degree compared to $977 for high school graduates with no college.
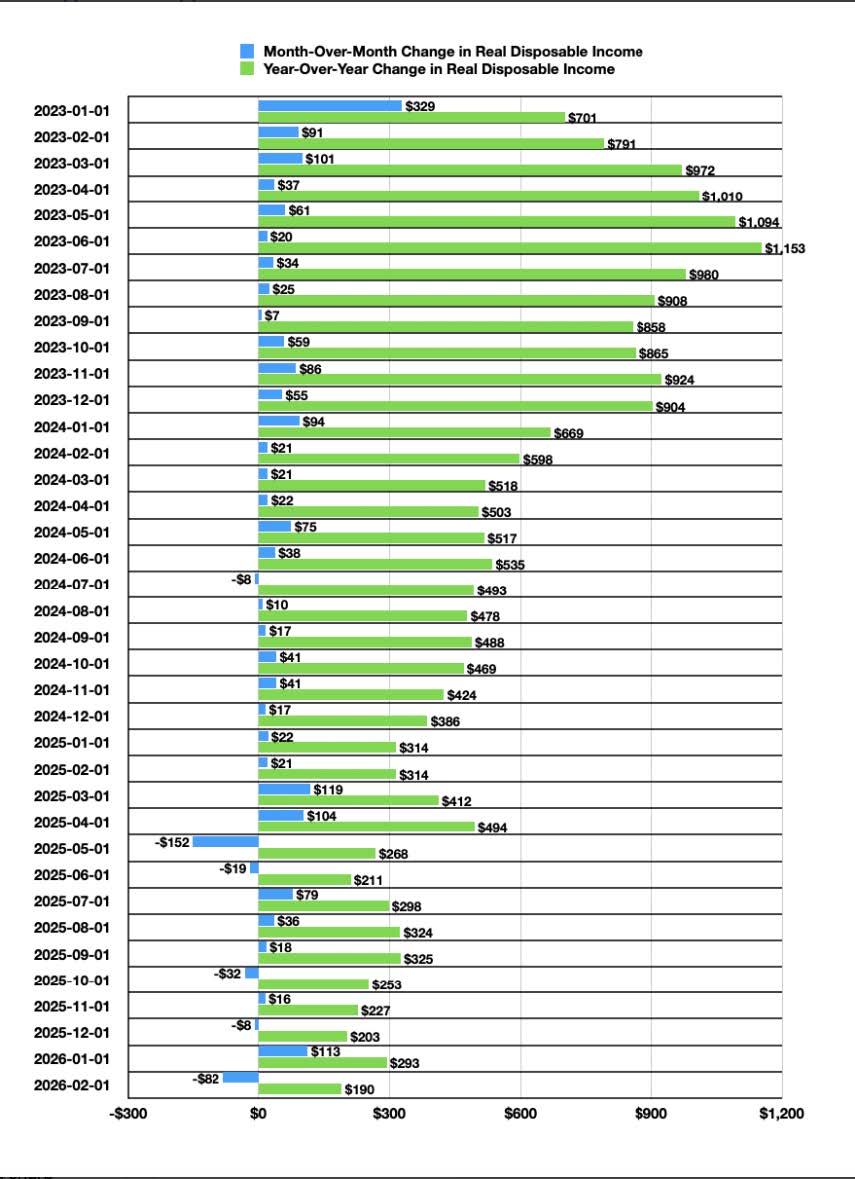
Wages may be keeping up with “official” inflation but looking further under the hood we see a different trend. Disposable income, what’s left over after paying the rent, the car payment, gas for the car, food, insurance, etc. has been trending down for quite some time. Using another “car analogy”, this is where the rubber meets the road. The paycheck may be just as big as it was three years ago, but it sure doesn’t feel like it for many people. This helps to explain why consumer confidence levels keep falling. All of the data in this report precedes the current “oil shock” and the inflation that it’s adding. Check out this interesting chart that displays monthly and annual changes in disposable income over the past 3+ years. It’s trending down!
Falling disposable income can translate into struggling to keep up with debt.
“Quietly but persistently, liabilities are reaching levels that are challenging some households. Inflation has diminished the real incomes that are necessary to sustain debt service. As a result, we are seeing higher defaults on consumer credit, particularly auto loans. Of late credit performance has been worse than the expected probability of default. Stress has become more common among all consumer strata. In particular, auto loan delinquency rates have approached levels last seen in the Global Financial Crisis (GFC).”
(Source, Ryan Boyle, Northern Trust, 01/15/2026)
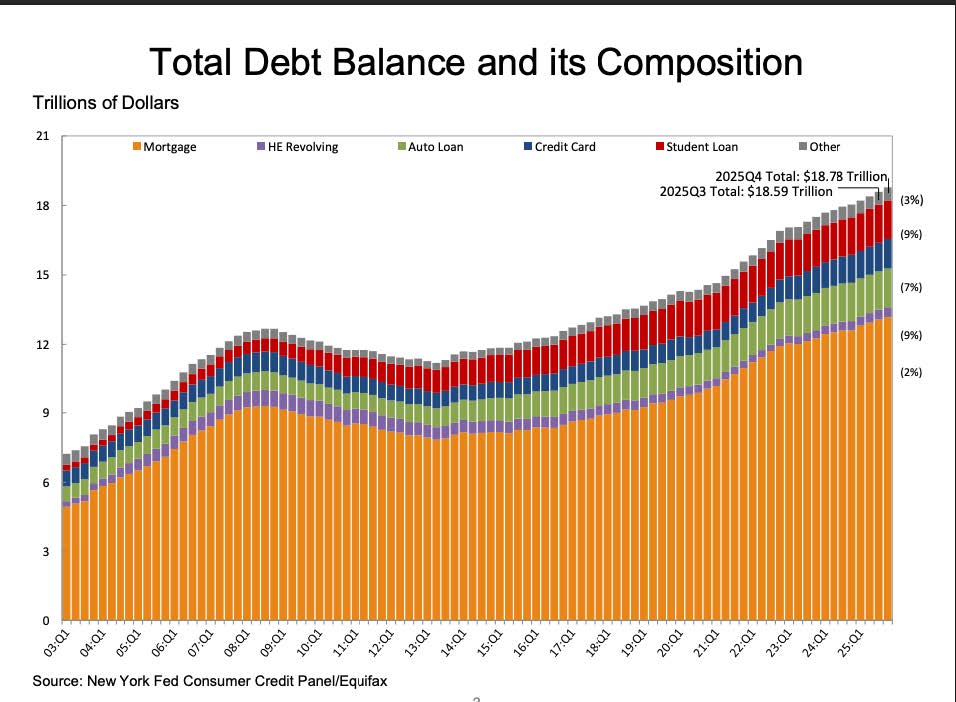
While many investors balance sheets continue to grow, because of the appreciation of their financial assets, the balance sheets of the non-investors are going the other way. This chart, from end of Q4 2025 shows growth of debt for American households, including mortgages, home improvement, auto loans, credit cards, student loans and “other”, for the past 22 years. The Global Financial Crisis marked a temporary peak back in 2008, followed by approximately 5 years of declining debt. The bottom came in 2013 and for the past 12 years debts have only gone up, currently totaling approximately $18.78 trillion.
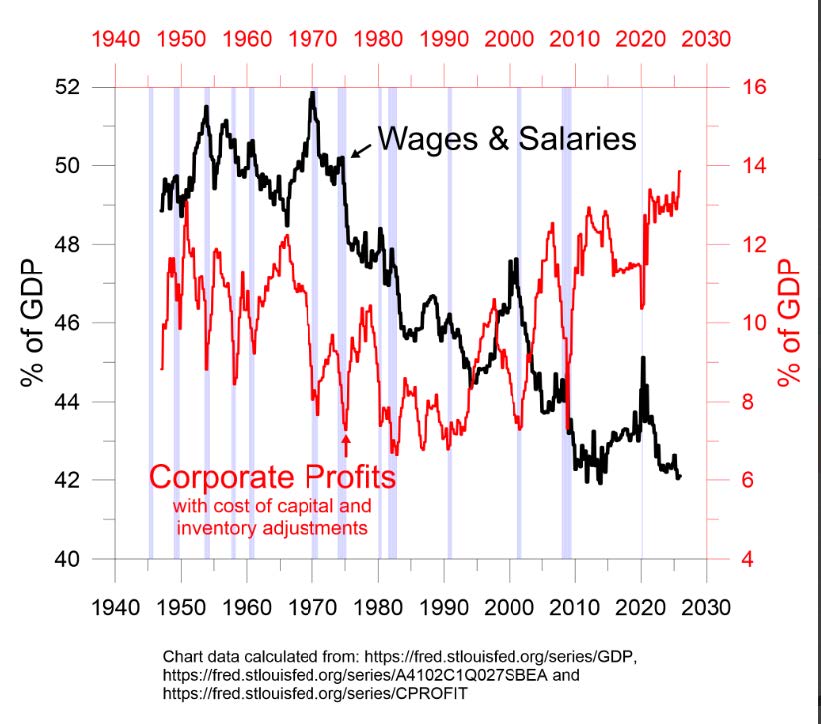
One of the reasons the disparity between the investors and non-investors, continues to grow it that wages and salaries, as a percentage of GDP, have been in a continuous decline since the early 1970’s. Corporate profits, as a percentage of GDP, have been rising since the 1980’s. Many of you may not even remember the days when one income could support a family of four, or more. That hasn’t been the norm for the past three of four decades. Simply stated, many people are working harder and longer for a smaller piece of the pie. All the while corporate profits have been rising, with dividends, stock buybacks, and share price appreciation accruing to investors. Here’s the chart.
I worry that the labor market looks vulnerable to future shocks, including those from AI. We’ve all been debating whether or not AI will cause job losses, but as time passes the trend is becoming clearer. It is contributing to job losses. For example, the following companies announced major layoffs in late 2025 or Q1 of 2026.

Reports from the likes of Oracle, Amazon, Intel, and Dell talk about shifting capital from human headcount into AI infrastructure. Companies are moving away from general sales and creative roles toward specialized AI engineering. UPS represents a broader trend in the service sector where automation in sorting facilities and the loss of major contracts (like the Amazon volume reduction) are leading to permanent structural changes.
I listened to an analyst on Bloomberg last week talking about the potential impact of AI on Morgan Stanley (MS). He said that MS spends $26.1 billion per year on wages and benefits. He projected that over the next couple of years they will be able to reduce that by approximately 10%, or $2.6 billion, as AI substitutes for people. If you want to point to one thing that heightens my fears about the great divide between investors and wage earners, this is it. Most of that $2.6 billion in savings will drop right to MS bottom line, increasing earnings and likely driving the stock price higher. Investors benefit, those laid off lose their incomes and probably fall further behind.
I often see the talking heads on CNBC or Bloomberg placing low probabilities of a recession during 2027 or 2028. That’s probably true, but what they tend to forget is that an enormous number of American households are effectively living in the equivalent of recession every day. They rarely, if ever, get a break from the economic stress. I don’t pretend to have the answers for resolving this great wealth divide or removing the stress from those who are experiencing it. But I feel it’s important to focus on the problem. History clearly tells us that extreme wealth concentration tends to act as a destabilizing force that can fundamentally alter a societies structure.
Read this excerpt from a recent report from the London School of Economics and tell me if you recognize these signs in our society today!
“Social cohesion is the mutual trust, sense of belonging and collective will that allow people to live together. Built on more than policies and institutions, it can be found in spaces like parks, libraries, community centers and faith halls, where people cross class lines to find fulfilment outside their daily routines. These moments of need lead to close contact between people from all kinds of backgrounds: interactions in a shared space, or common ground, in both the literal and metaphorical sense.
But as inequality rises, these encounters decrease, and social hierarchies harden. People increasingly view one another not as a source of cooperation and assistance, but as threats and rivals. This breakdown in trust damages interpersonal relationships, the quality of interactions in daily life, and our collective ability to confront shared challenges. When inequality is high, a sense of shared fate diminishes, as people no longer feel bound together by common purpose or mutual obligation. This leads to a struggle over public goods (who deserves what, and why?) and makes it harder to implement meaningful policies that support common well-being. In turn, governments struggling with mistrust and divisiveness often turn to enforcement mechanisms, such as policing and punitive control, instead of trust-based governance.
As inequality grows, so does the concentration of political influence. Wealth, in our current economic system, can be exchanged for influence and authority. When it concentrates in the hands of a few, electoral candidates increasingly rush to represent the ultra-rich minority, further separating ordinary people from major policy decisions that affect them and their lives. Research shows that when income inequality goes up, the level of commitment to democratic governance goes down….
To hold the center, what’s needed is an agenda based around community cohesion – and which names inequality as its root concern. Despite the mounting evidence of the social damage wrought by economic inequality, political will continues to lag far behind. For too long the idea has endured that countries can function with stripped-down public spending and rising inequality, yet we know that the long-term social costs are colossal, or indeed, fatal”.
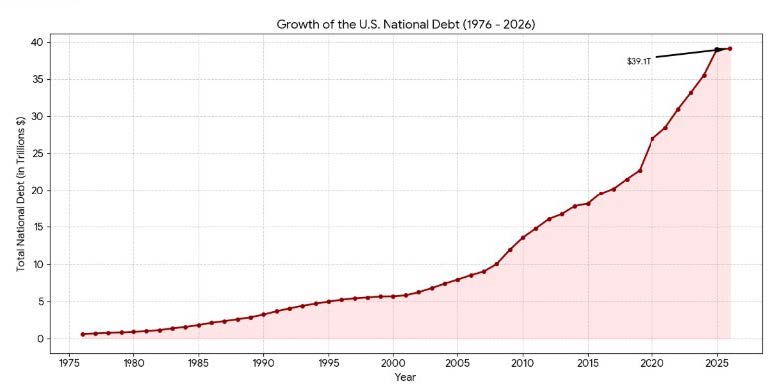
I’d love to see us deal with the great wealth divide before it becomes fatal, but it’s hard to be optimistic while those that govern continue to ignore the problem. They spend us further into debt, while at the same time cutting safety nets. The total U.S. national debt crossed $39 trillion this month. That is $116,350 for every American citizen. I don’t know about you, but if I’m running up debt, I’d like to have more say in its creation! The debt is currently growing at a rate of $1 trillion every 100 days. (Source: U.S. Debt Clock). The annual interest cost exceeds $1 trillion per year.
The rapidly growing debt comes up often in conversations and has clearly become a primary concern for investors and non-investors alike. The bigger it gets the more potential risk it poses. It’s grown quickly over the past 25 years because of two major factors. First, our government stimulates the economy continuously with borrowed money, regardless of which party is running the show. They’ve cushioned the blows from recessions, a near depression (Great Financial Crisis of 2008-2009, and pandemics. It’s been a very convenient tool.
Second, during the past several decades the trend has been to decrease corporate tax rates, based on the theory that more after tax profits will stimulate the economy and everyone will benefit. We’ve confirmed that corporations do benefit, so do their shareholders, but “workers” don’t. They’re actually working for the smallest piece of GDP since the 1940’s. Leadership of both parties has failed to find ways to reduce the debt when times are good. Democrats argue that Bill Clinton did it. Republicans argue that a GOP-controlled congress, under New Gingrich forced spending cuts on him. Today there is NO collaboration for the greater good. There is no “saving for a rainy day” and that will inevitably lead to problems in the form of higher interest rates, higher taxes, and slower economic growth. Especially in the de-dollarization global economy that exists today.
We may get to a point where a traditional portfolio of 60% stocks and 40% bonds doesn’t work anymore. We got a preview of that in 2022 when both were down dramatically. Many worry that stock prices have gotten way ahead of themselves, and there is some evidence of that. The chart below shows the history of the S&P 500’s “price to sales”. It’s currently at 3.259. It’s average has been 1.146, dating back to 1947.
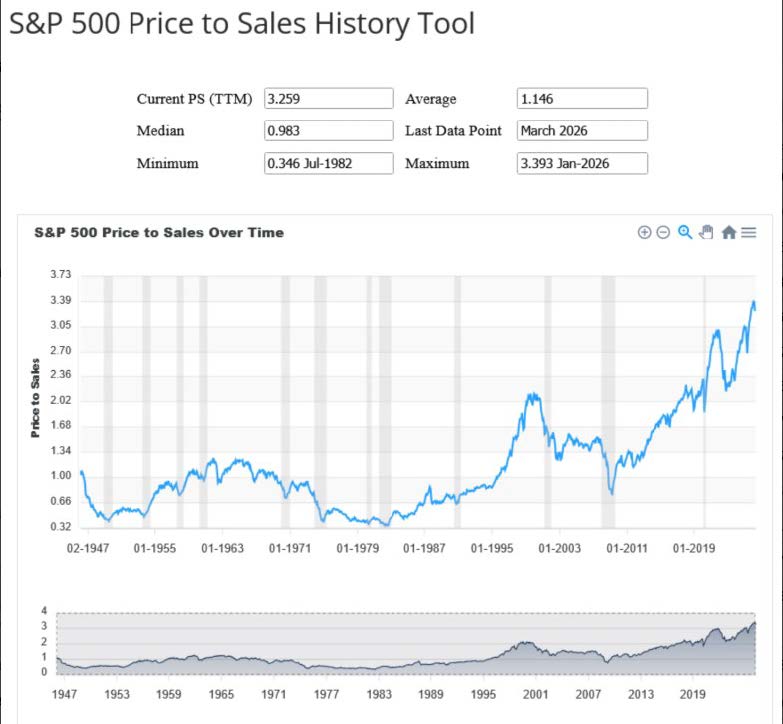
Stocks being overpriced is something to note, but it doesn’t necessarily mean they’ll just fall from here. “Overbought” conditions can stay overbought. Sometimes markets correct by going sideways for a while. In the end, corrections are inevitable. Recessions aren’t necessarily inevitable, but they do happen, and stock prices do correct. If you look at the chart closely you’ll notice that there have been 12 recessions since 1947. The longest period between any two of them was 2009 to 2020, Great Financial Crisis to Covid. The “Covid” recession was the shortest, and we haven’t had one since. Stimulus from both the government and the Fed has been the largest and most consistent during this 17 year period.
We are not sitting idle at 5T waiting for one to happen. Over the past several months Chris and I have been working on two new strategies that are alternatives to “60/40” or other strategies that rely totally on stocks and bonds. 5T All Weather will be available to clients on April 30, 2026. Cash Plus will be available on May 30, 2026. Neither are totally dependent on rising stock prices and rising bond prices. We’ve “burned the midnight oil” to make sure we have options for nervous investors to keep investing, even when the traditional strategies aren’t working.
I want you to understand that I wrote this letter to stay honest with you, not to frighten you. The charts in this letter show us how vulnerable many families are to any downturn in the economy. The cost of the war with Iran is clouding the economic picture. The aftermath, particularly the real cost of energy, may cloud it even more. We do want you to be aware of conditions lurking in our economy that could cause problems. We also want you to be aware that we are working on solutions for investors.
All the best,

Paul Krsek
CEO
5T Wealth, LLC
Main (707) 224-1340
Cell (707) 486-7333
Paul@5twealth.com

Disclosure and Disclaimer - Updated last on October 14, 2025:
CEO's Corner is a proprietary newsletter written for clients, friends, and affiliates of 5T WEALTH, LLC (5T), which is an SEC registered investment advisor. Information presented is for educational purposes only. The information does not intend to make an offer or solicitation for the sale or purchase of any specific securities, investments, or investment strategies. Investments involve risk and are not guaranteed. 5T has reasonable belief that this letter does not include any false or material misleading statements or omissions of facts regarding services or investments. 5T has reasonable belief that the content as a whole will not cause an untrue or misleading implication regarding the adviser’s services, investments, or client experiences.
The opinions expressed are those of the author and are subject to change without notice. The opinions referenced are as of the date of publication and are subject to change due to changes in the market or economic conditions and may not necessarily come to pass. Any opinions, projections, or forward-looking statements expressed herein are solely those of the author. They may differ from the views or opinions expressed by other areas of 5T and are only for general informational purposes as of the date indicated.
5T has presented information in a fair and balanced manner. 5T is not giving tax, legal, or accounting advice.
Past performance should not be considered an indicator of potential future performance. If you do not consider yourself suitable, either emotionally or financially, to experience volatility and/or losses in financial markets, you should not invest. The portfolio managers at 5T do not guarantee investment results.
Charts, displays and graphs may be used as illustrations. They are not intended to be used by themselves to determine which securities to buy or sell, or when to buy or sell them. Such charts and graphs offer limited information and can’t be used on their own to make investment decisions.
CEO Corner does not represent the opinions of Fidelity, Fidelity Institutional Brokerage Group, NFS or anyone employed by Fidelity in any capacity. Neither Fidelity, Fidelity Institutional Brokerage Group, nor NFS, nor anyone employed by Fidelity in any capacity has participated in the creation of CEO Corner and they are not responsible for the contents or distribution of CEO Corner.
CEO Corner does not represent the opinions of Charles Schwab Corporation, Schwab Advisor Services or anyone employed by Schwab in any capacity. Neither Charles Schwab Corporation nor Schwab Advisor Services, nor anyone employed by Schwab in any capacity has participated in the creation of CEO Corner and they are not responsible for the contents or distribution of CEO Corner.
The investment objectives of various strategies mentioned in CEO Corner may be substantially different from one another. Therefore topics or investments mentioned in CEO Corner may or may not apply to specific managed accounts and/or strategies. If you are unsure which strategies your accounts are invested in please ask a representative of 5T to clarify that for you.
The assets held in managed accounts at 5T may include stocks, bonds, cash, commodities, foreign exchange, mutual funds or exchange traded funds (ETF's), money market accounts or limited partnerships that represent the same. They are subject to market fluctuation and the potential for losses. The assets are not insured. The value and income produced by these investment products may fluctuate, so that an investor may get back less than they initially invested.