

Short Term Breather Ahead for the Stock Market?
The answer to that question is, I believe so, but I’m thinking “breather”, not “collapse”. Some of our clients have been holding their breath in anticipation of a collapse. Concern has been rising about overvaluation in U.S. stocks, particularly growth stocks related to AI. This is a key driver of the fear. Here’s a few recent headlines:
AI BUBBLE BURST? Big sell-off in semiconductor stocks drags Nasdaq and global stocks lower. (Financialexpress.com)
Are US Stock Market Valuations Outpacing Fundamentals? (goldmansachs.com)
US Stock Market Outlook: It’s Time to Reallocate from Growth to Value (Morningstar.com)
The big question has been whether or not AI will pay off economically for the companies spending billions to make it a reality. I must tell you I love AI. I use Google Gemini every day now, for all kinds of things. I’m grateful for the tool. Will all the investment turn out to be worth it for Google? I honestly don’t know. I hope so. But it’s proving to be enormously helpful in productivity for others, like 5T Wealth, LLC. I believe that by the end of 2026 we will be able to look back and point to it as increasing our profitability as well.
In the meantime, we’re all left to speculate about how valuable the chip companies, hyperscalers, and other developers of AI will become. After weeks of climbing the “Wall of Worry” the market seems to have grown impatient waiting for the answer. The AI growth stocks are finally taking a breather. This is a chart of AIQ (Global X Artificial Intelligence & Technology ETF last Friday afternoon, down about -17% from hits June high.
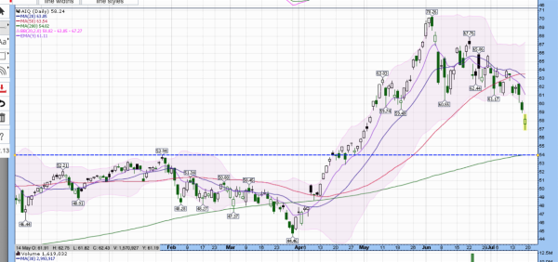
I drew the horizontal blue line because that could be a target level to which AIQ drops. It matches the old high put in January 2026 and the 200 day simple moving average (SMA). I realize the chart is small, and numbers hard to see. It would be an additional 6 to 7% correction for AIQ to drop to the 200 day SMA. The correction has already gone far, very quickly, so it could be over at Friday’s closing level. Either way it could play out this week.
The top 10 positions in AIQ are SK Hynix, Inc ( Korean chip maker) , Micron Technology, Advanced Micro Devices, Samsung, Intel, Cisco, Apple, Taiwan Semiconductor, Broadcom and Nvidia. That’s a “who’s who” of AI leaders.
Also down from their recent highs are SMH (Van Eck Semiconductor ETF) -17%; MTUM (iShares USA Momentum Factor ETF) -15%; XLK (State Street Technology Select Sector SPDR ETF) -12%. These are significant corrections in four of the leading exchange traded funds in the AI space. Should the correction be causing you a lot or worry? I can answer that question by telling you that I’m not yet worried. I welcome this correction for taking some froth off this important sector of the broader market. I’m also pleased to say that Chris Roth guided us to reduce position size of AIQ, MTUM and XLK across our strategies before the correction started.
The broader market has held up much better as investors rotated into other sectors, including more “value oriented positions”. Ed Yardeni, a highly respected researcher and manager recently said, "Everybody's kind of tired trying to figure out who's going to make money in all this. So, what you're seeing is the market rotate to companies that everybody understands their business." Here’s the chart of the Wilshire 5000 last Friday afternoon. Every publicly traded stock in the USA is in this index. You can see it has trended sideways since June, but it hasn’t broken down like the AI heavy indexes and ETF’s have. I’ll worry more if it does.
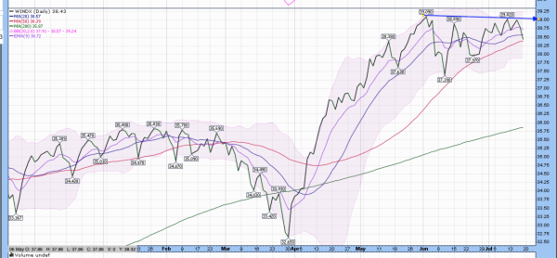
What’s easy for me to imagine is that the U.S. stock market “takes a breather”, trends sideways, chops up and down, for the next couple of months. Look at the chart again and focus on that big move up from April to early June. If you had gorged yourself on a meal that big wouldn’t you feel like taking some time to absorb it? Besides, historically August and September are the most challenging back-to-back months of the calendar year for U.S. stocks. They are coming right up!
Going back to 1950, the S&P 500’s average return for August hovers around a near flat minus 0.01%. Trading volume often drops significantly during August as institutional asset managers and traders take summer vacations. The slow trading and lower liquidity that comes with it can cause deceptive brief rallies early in the month that quickly fizzle out. This sometimes leads to increased vulnerability and sudden, sharp drawdowns on light news flow.
September holds the reputation for being the absolute worst-performing month of the year for stocks. Looking at long-term historical data, September is the only month where the S&P 500 has consistently averaged a clear negative return, dropping by an average of roughly to depending on the exact historical timeline used. Furthermore, the market finishes in negative territory more frequently in September than in any other calendar month.
This trend became quite exaggerated between 2020 and 2023. Septembers experienced steep average retreats (such as a drop in 2021, in 2022, and in 2023) as macro adjustments and tech sector corrections hit right as summer ended. (Source of all data: ZeroHedge.com)
Here’s the good news. Historically, if the market has enjoyed a massive bull run leading into August, the late summer drop behaves more like a standard, healthy consolidation or mild pullback. Do you know what usually follows healthy consolidations or mild pullbacks? Resumptions of bull markets usually follow. If you look at the market over the past several months, we did have a massive run up off the April low to the June high. If you want to think longer term we are now in the 4th year of a gigantic bull market that started in October 2022. We’ve experienced three large corrections during its run.
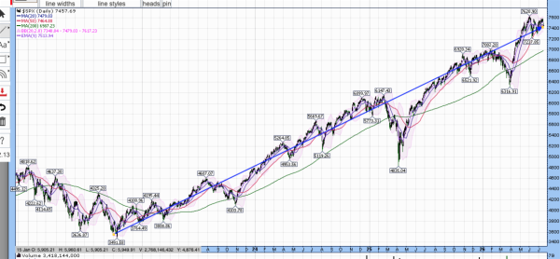
I’m always reminded that “a picture says a thousand words.” Right now the pictures, or charts, of the AI related market are down. Investors have been taking profits and rotating elsewhere. If the rotation stops, and the correction spreads to the broader market, it will show up in the charts of the Wilshire 5000 and the S&P 500. They will break down. In the meantime, don’t hold your breath. Just breathe and enjoy your summer. We will be watching!
All the best,

Paul Krsek
CEO
5T Wealth, LLC
Main (707) 224-1340
Cell (707) 486-7333
Paul@5twealth.com

Disclosure and Disclaimer - Updated last on October 14, 2025:
CEO's Corner is a proprietary newsletter written for clients, friends, and affiliates of 5T WEALTH, LLC (5T), which is an SEC registered investment advisor. Information presented is for educational purposes only. The information does not intend to make an offer or solicitation for the sale or purchase of any specific securities, investments, or investment strategies. Investments involve risk and are not guaranteed. 5T has reasonable belief that this letter does not include any false or material misleading statements or omissions of facts regarding services or investments. 5T has reasonable belief that the content as a whole will not cause an untrue or misleading implication regarding the adviser’s services, investments, or client experiences.
The opinions expressed are those of the author and are subject to change without notice. The opinions referenced are as of the date of publication and are subject to change due to changes in the market or economic conditions and may not necessarily come to pass. Any opinions, projections, or forward-looking statements expressed herein are solely those of the author. They may differ from the views or opinions expressed by other areas of 5T and are only for general informational purposes as of the date indicated.
5T has presented information in a fair and balanced manner. 5T is not giving tax, legal, or accounting advice.
Past performance should not be considered an indicator of potential future performance. If you do not consider yourself suitable, either emotionally or financially, to experience volatility and/or losses in financial markets, you should not invest. The portfolio managers at 5T do not guarantee investment results.
Charts, displays and graphs may be used as illustrations. They are not intended to be used by themselves to determine which securities to buy or sell, or when to buy or sell them. Such charts and graphs offer limited information and can’t be used on their own to make investment decisions.
CEO Corner does not represent the opinions of Fidelity, Fidelity Institutional Brokerage Group, NFS or anyone employed by Fidelity in any capacity. Neither Fidelity, Fidelity Institutional Brokerage Group, nor NFS, nor anyone employed by Fidelity in any capacity has participated in the creation of CEO Corner and they are not responsible for the contents or distribution of CEO Corner.
CEO Corner does not represent the opinions of Charles Schwab Corporation, Schwab Advisor Services or anyone employed by Schwab in any capacity. Neither Charles Schwab Corporation nor Schwab Advisor Services, nor anyone employed by Schwab in any capacity has participated in the creation of CEO Corner and they are not responsible for the contents or distribution of CEO Corner.
The investment objectives of various strategies mentioned in CEO Corner may be substantially different from one another. Therefore topics or investments mentioned in CEO Corner may or may not apply to specific managed accounts and/or strategies. If you are unsure which strategies your accounts are invested in please ask a representative of 5T to clarify that for you.
The assets held in managed accounts at 5T may include stocks, bonds, cash, commodities, foreign exchange, mutual funds or exchange traded funds (ETF's), money market accounts or limited partnerships that represent the same. They are subject to market fluctuation and the potential for losses. The assets are not insured. The value and income produced by these investment products may fluctuate, so that an investor may get back less than they initially invested.