

Stocks are Performing. Bonds are not!
In my last few newsletters I’ve focused on concerns about rising interest rates becoming a headwind for stocks. I’ve mentioned that August and September are often two of the tougher months for stock market performance. I’ve speculated that stock prices might “take a breather” during those two months. “September holds the reputation for being the absolute worst performing month where the S&P 500 has consistently averaged a clear negative return….” But I also said, “Historically, if the market has enjoyed a massive bull run leading into August, the late summer drop behaves more like a standard, healthy consolidation or mild pullback. Do you know what usually follows healthy consolidations or mild pullbacks? Resumptions of bull markets usually follow.”
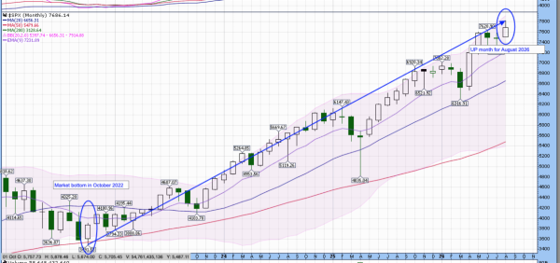
Not only have we enjoyed a massive bull market for almost four years, the S&P 500, the Nasdaq 100 and the Dow Jones Industrial Average all ended August up for the month. The tech heavy QQQ (Nasdaq 100) led major index ETF’s, driven by strong second quarter mega-cap earnings reports. Both the SPY (S&P 500) and the DIA (Dow Jones Industrial Average) posted gains across industrials, healthcare and financials. Here is a chart of the S&P 500, showing the market bottom in October 2022, the long-term upward trend, capped off by a solid August 2026trend, capped off by a solid August 2026.
Andrew McElroy, Matrixtrade.com, recently published “Don’t Believe Everything You Read About September” on SeekingAlpha.com. He pointed out that “the worst Septembers almost all had a bearish run-in (a bad August). On the other hand, the best Septembers tended to have a positive run-in (a good August).” We had a positive August, which may mean stocks will avoid a big draw down in this often perilous two month period. He also mentions 8100 as a potential year-end target for the S&P 500. That matches the price targets of Oppenheimer Asset Management and Citigroup. Goldman Sachs and Deutsche Bank are currently at 8000. Ed Yardeni, Yardeni Research, currently has the highest target on the street at 8400. As I am drafting on Tuesday morning, September 1, 2026 the S&P 500 is at 7639.
None of this optimism or historic information guarantees that the broad stock market will continue its upward momentum. There are plenty of negative catalysts looming that could knock it down. But August price action does lend credence to our “base case” as reported in our last newsletter, on August 17, 2026.
“I’ve long been concerned that rising interest rates will eventually kill the stock bull market. I believe that long term rates will keep rising, which adds to my worries for longer term outcomes. Even so, stocks are not likely to suffer a significant setback in 2026. My base case for the rest of the year, which Chris Roth agrees with, is as follows:
1. The upward trend is our friend.
2. Wall Street clearly wants this market to continue upward.
3. The AI trade will continue to lead.
4. Pullbacks are buyable.
5. If one sector gets too far ahead, it will be sold, but money will rotate to other equity sectors.
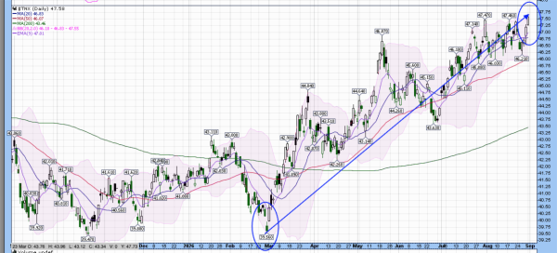
We could add that money has been rotating out of bonds and into stocks. As the title of this letter says, “Stocks are performing, bonds aren’t”. Bond prices are taking a real hit. Here’s two charts that tell the bond market story so far in 2026. The first one is tracking the yield of the 10-year U.S. Treasury Note. You can see that it bottomed in March and had been steadily climbing ever since.
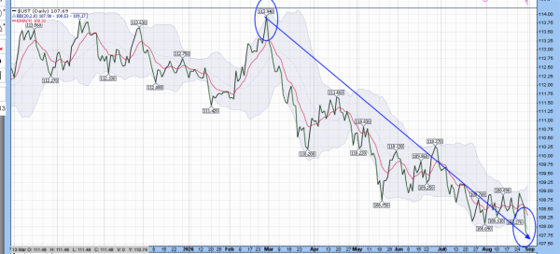
While yields have been rising, bond prices have been falling. The second chart, below, is showing you the price downtrend of the 10-Year U.S. Treasury Note. Theres’ a simple inverse relationship between yield and price. As yields on newly issued bonds rise, previously issued bond prices fall.
The “upshot” is that bonds have significantly underperformed in 2026. Here’s an excel spreadsheet that shows you the actual holdings of an account invested in our Core 60/40 strategy. The assets on lines 4 through 17 are stock positions. The assets on lines 20 through 27 are bond positions. It’s easy to see that almost 100% of the gains in this account are in the stock positions.
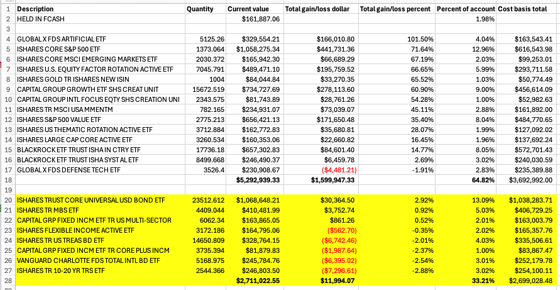
In 2026 all investment accounts holding stocks and bonds are having similar experiences. Stocks are up. Bonds are not. The good news is the stocks are up a lot! We’ve had many conversations with clients who are worried about stocks collapsing. We haven’t had a single conversation with anyone who’s afraid of bonds collapsing or underperforming. We have clients who have moved to cash because of their fear of the stock market. None have done so because of their fear of the bond market. Personally I’m more worried about the bond market. If yields get to lofty they will negatively impact stock prices, but I don’t believe we are quite there yet. Eventually it will be a combination of how high yields get and how fast they rise that could end the stock bull market.
For now, Wall Street consensus estimates project earnings growth of approximately 25% to 29% over the next 12 months. (Source: FactSet Earnings Insight, August 28, 2026) Growth expectations continue to broaden into industrials, financials, and healthcare.
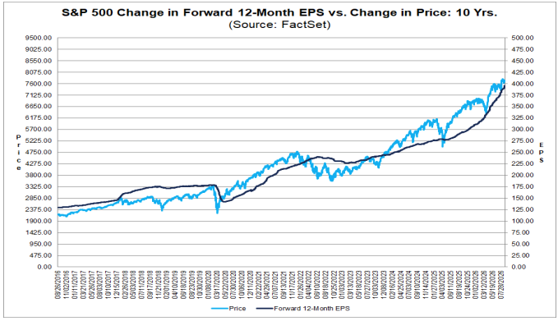
The forward 12-month Price to Earnings (P/E) ratio for the S&P 500 sits at 19.6, modestly below its 5-year benchmark of 19.9, and slightly above its long-term historical benchmark of 19.00. (Source: FactSet) For all the worrying many of us have done over the past year, it’s impossible to refute how strong earnings have been. If that earnings growth continues apace current year-end price targets seem reasonable, so long as the upward trend of interest rates doesn’t accelerate.
All the best,

Paul Krsek
CEO
5T Wealth, LLC
Main (707) 224-1340
Cell (707) 486-7333
Paul@5twealth.com

Disclosure and Disclaimer - Updated last on October 14, 2025:
CEO's Corner is a proprietary newsletter written for clients, friends, and affiliates of 5T WEALTH, LLC (5T), which is an SEC registered investment advisor. Information presented is for educational purposes only. The information does not intend to make an offer or solicitation for the sale or purchase of any specific securities, investments, or investment strategies. Investments involve risk and are not guaranteed. 5T has reasonable belief that this letter does not include any false or material misleading statements or omissions of facts regarding services or investments. 5T has reasonable belief that the content as a whole will not cause an untrue or misleading implication regarding the adviser’s services, investments, or client experiences.
The opinions expressed are those of the author and are subject to change without notice. The opinions referenced are as of the date of publication and are subject to change due to changes in the market or economic conditions and may not necessarily come to pass. Any opinions, projections, or forward-looking statements expressed herein are solely those of the author. They may differ from the views or opinions expressed by other areas of 5T and are only for general informational purposes as of the date indicated.
5T has presented information in a fair and balanced manner. 5T is not giving tax, legal, or accounting advice.
Past performance should not be considered an indicator of potential future performance. If you do not consider yourself suitable, either emotionally or financially, to experience volatility and/or losses in financial markets, you should not invest. The portfolio managers at 5T do not guarantee investment results.
Charts, displays and graphs may be used as illustrations. They are not intended to be used by themselves to determine which securities to buy or sell, or when to buy or sell them. Such charts and graphs offer limited information and can’t be used on their own to make investment decisions.
CEO Corner does not represent the opinions of Fidelity, Fidelity Institutional Brokerage Group, NFS or anyone employed by Fidelity in any capacity. Neither Fidelity, Fidelity Institutional Brokerage Group, nor NFS, nor anyone employed by Fidelity in any capacity has participated in the creation of CEO Corner and they are not responsible for the contents or distribution of CEO Corner.
CEO Corner does not represent the opinions of Charles Schwab Corporation, Schwab Advisor Services or anyone employed by Schwab in any capacity. Neither Charles Schwab Corporation nor Schwab Advisor Services, nor anyone employed by Schwab in any capacity has participated in the creation of CEO Corner and they are not responsible for the contents or distribution of CEO Corner.
The investment objectives of various strategies mentioned in CEO Corner may be substantially different from one another. Therefore topics or investments mentioned in CEO Corner may or may not apply to specific managed accounts and/or strategies. If you are unsure which strategies your accounts are invested in please ask a representative of 5T to clarify that for you.
The assets held in managed accounts at 5T may include stocks, bonds, cash, commodities, foreign exchange, mutual funds or exchange traded funds (ETF's), money market accounts or limited partnerships that represent the same. They are subject to market fluctuation and the potential for losses. The assets are not insured. The value and income produced by these investment products may fluctuate, so that an investor may get back less than they initially invested.